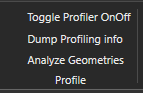
This add-on brings the following buttons to your Home tab ribbon:
Profiling performance
With “Toggle Profiler OnOff” and “Dump Profiling info” one can view simulation performance-related indicators in the output panel and in a dumb csv file located in the command folder.
How to use performance profiling:
Enable profiling with the toggle button
Run the simulation for long enough duration with a high speed factor
Typically at least a duration until all processes have been completed at least once.
Pause or reset and hit the dump button to view the results
Each time simulation is started over the profiling info/dump will be overwritten and recollected during the simulation. Toggling off between simulation runs is not necessary.
To stop profiling click the toggle again
The results:
The output panel will show total system time spent and the top 20 most performance expensive components in the layout along with the number of calls to component behaviors including python scripts and the amount of system time spent per component. All data (beyond the top 20 list) is dumped to a file located in a folder shown in the output message.
Analyzing geometries
With “Analyze geometries” one can view the quality of the geometries in the layout. Just click the button to output the results.
The results:
A warning will be shown for any component exceeding the recommended triangle (polygon) count of 100 000.
Total component, node, geometry set, triangle, line, point, and frame count
Average of geometry sets, triangles, lines and points per component
Average of component sharing ration
Number of shared components
Both, the profiling and geometry analysis can be used to tweak and troubleshoot layouts that are not performing well enough. It will indicate the components that need the most attention.
is there a version for this add-on which is compatible with VC Professional 4.4?
When I try to use this I get the error message “No module named vcCommand” for the command line “from vcCommand import *”.
To optimize the simulation, I thought it would be good to use this Addon together, so I’m going to use it.
But if I do dump profiling after turning on, I get the following error.
IOError: [Errno 2] No such file or directory: ‘C:\Users\OneDrive - \xeb\xac\xb8\xec\x84\x9c\Visual Components\4.10\My Commands\Python 2\Profiler\output_comp.csv’
Maybe it has Korean in that file directory, so I can’t read the path of the file properly. Is there a way to modify it?