Hi everyone,
I want to create some Charts for my custom Components using the Python API.
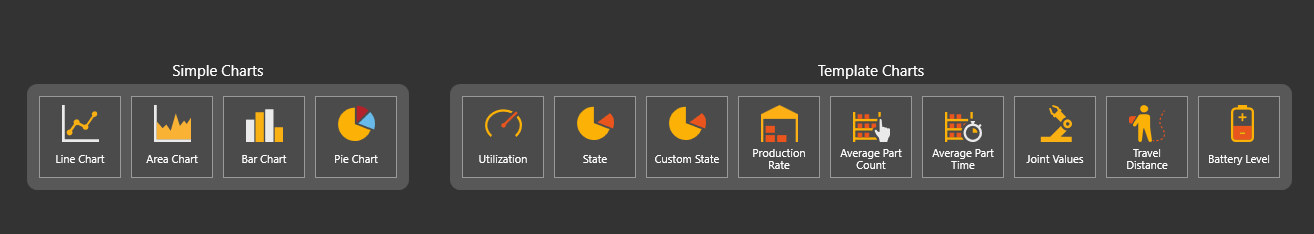
For the Simple Charts there is the command “createChart” but the Template Charts are not included.
I found this related post for customizing the colors of plots: Change Statistics Colors which was quite insightful, but seems still the solution would be to copy the functions from VC Libraries in order to create those charts with python API or “manually” reconstruct the Templates using simple charts.
Does anyone have any better suggestion?
Thanks in advance!