Hello colleagues,
I have almost zero experience with statistics and I wasn’t able to find a tutorial which fits to my needs.
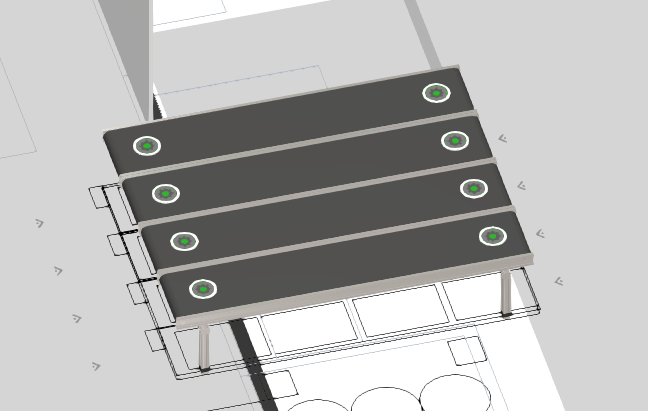
This is my “handover” area between warehouse and production line consisting of 4 conveyors and 8 process nodes.
What I would need to create is statistics dashboard of total utilization of this zone (not single conveyor) + total production rate (how many components were transported through) and somehow track blocked state.
I would appreciate any advices.
Thank you.