I would like to see the distribution of the broken time and the repair time of a ProLathe machine.
I generated a statistical chart to show the percentage of time the machine is broken and in repair. However, it doesn’t display the percentage of time spent repairing. You can see in the simulation that only the Idle, or the percentage of time the machine is broken or busy, is mentioned. However, there is no red area indicating that the machine is being repaired.
Also, when parts arrive in a running machine, they go straight to the sink instead of waiting in the machine for repair and then being processed. Do you have any idea why?
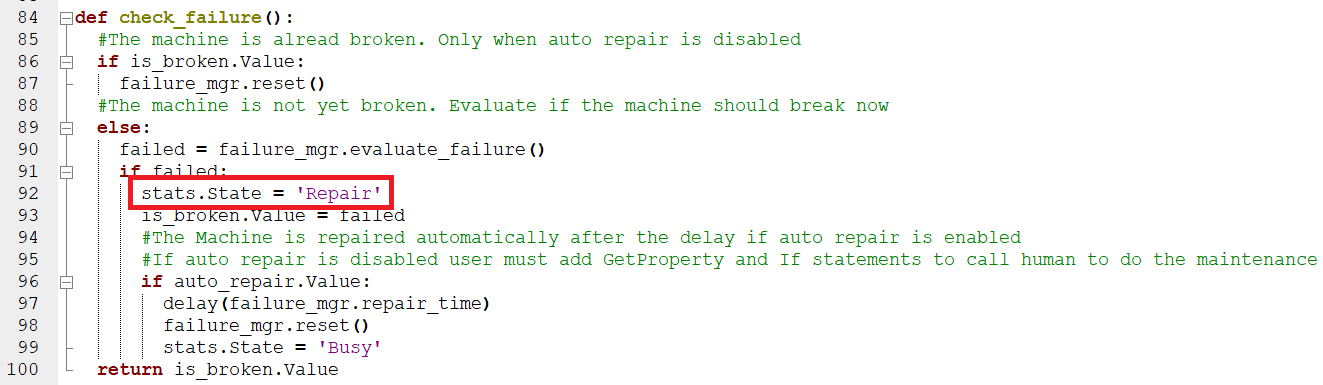
Hi, because it is set to auto-repair, there will be no “Broken” state, as it will directly repair, changing stats.State = ‘Broken’ to stats.State = ‘Repair’
Restart VC to update eCat or execute this .exe under VC installation folder to update eCat manually