Hi there,
since I did not really find a proper way to get a value for Parts per Minute on a conveyor, I decided to go for something by myself.
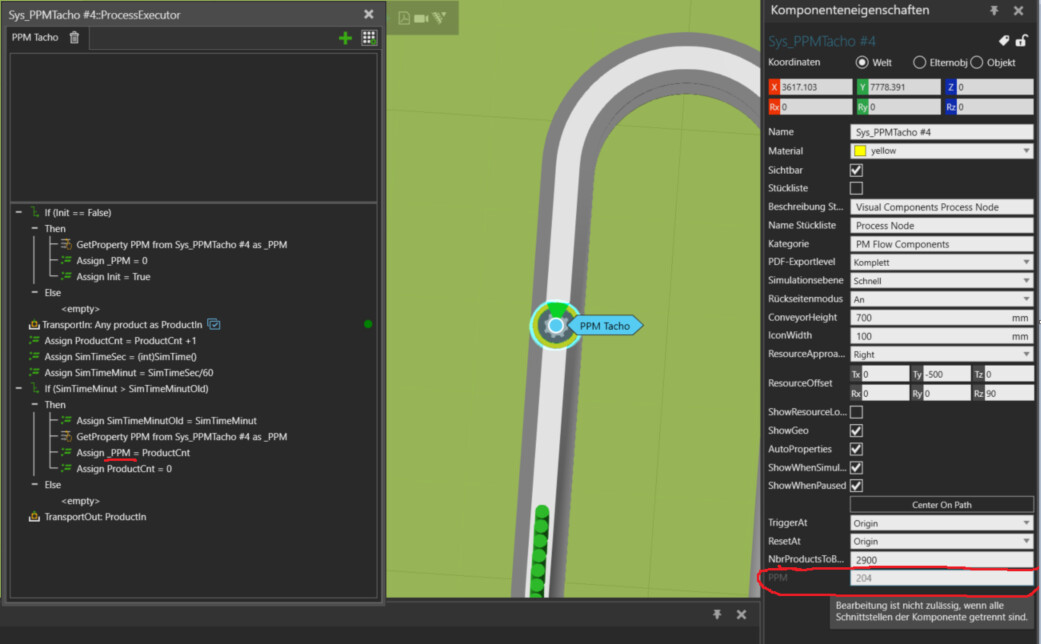
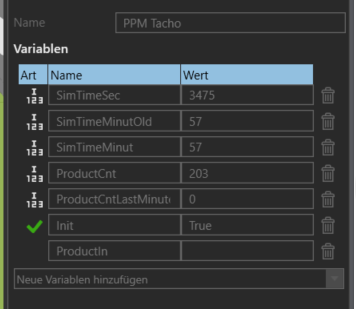
This Process Node Counts the Parts and gives a Feedback on the Variable PPM each minute.
The Varible for example can be used quiet easy in an statistics Graph.
For everyone who is interested in:
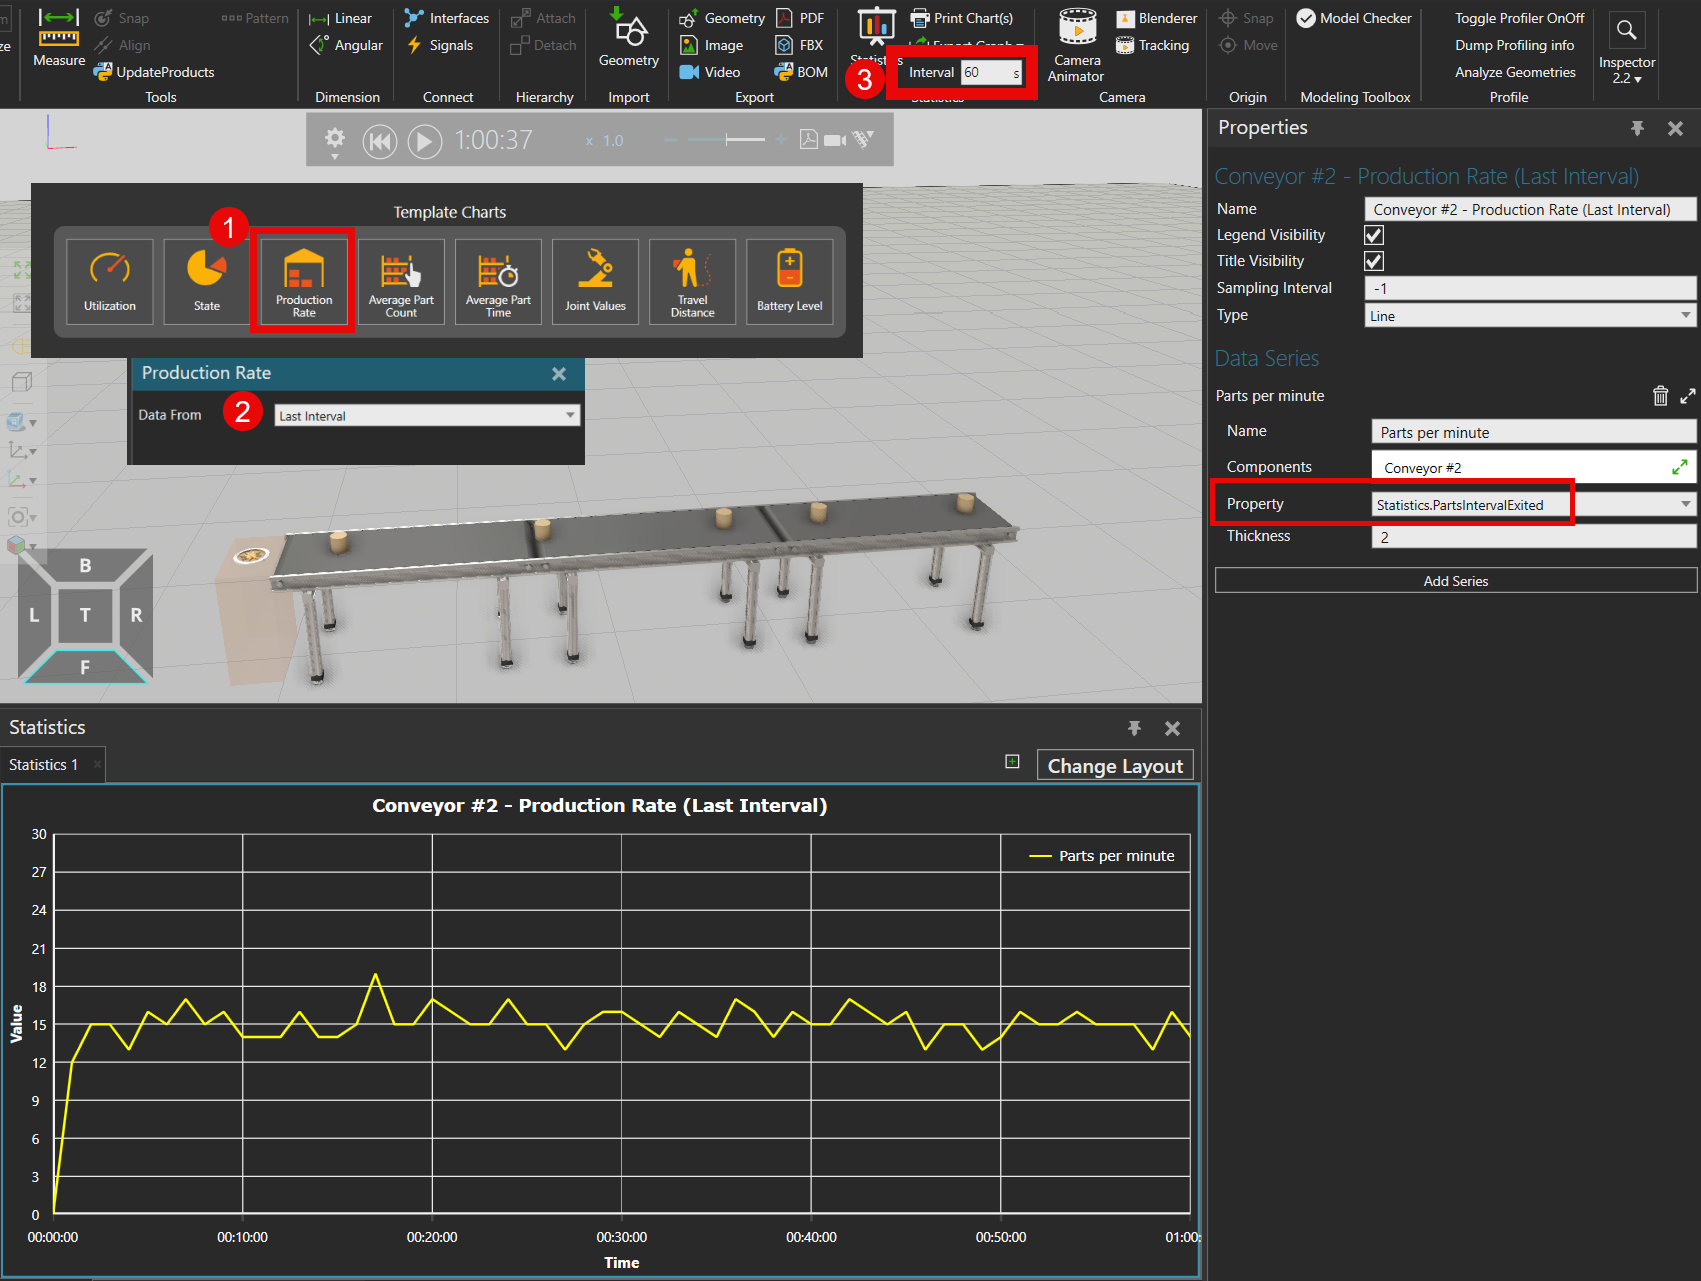
If you add a graph with the Template Chart “Production Rate” for a conveyor, and use the data from the last interval (the standard option), it will reset the data according to the statistic interval you use. So if you leave the interval on 60s, you’ll have very simply the Parts per minutes shown in your graph.
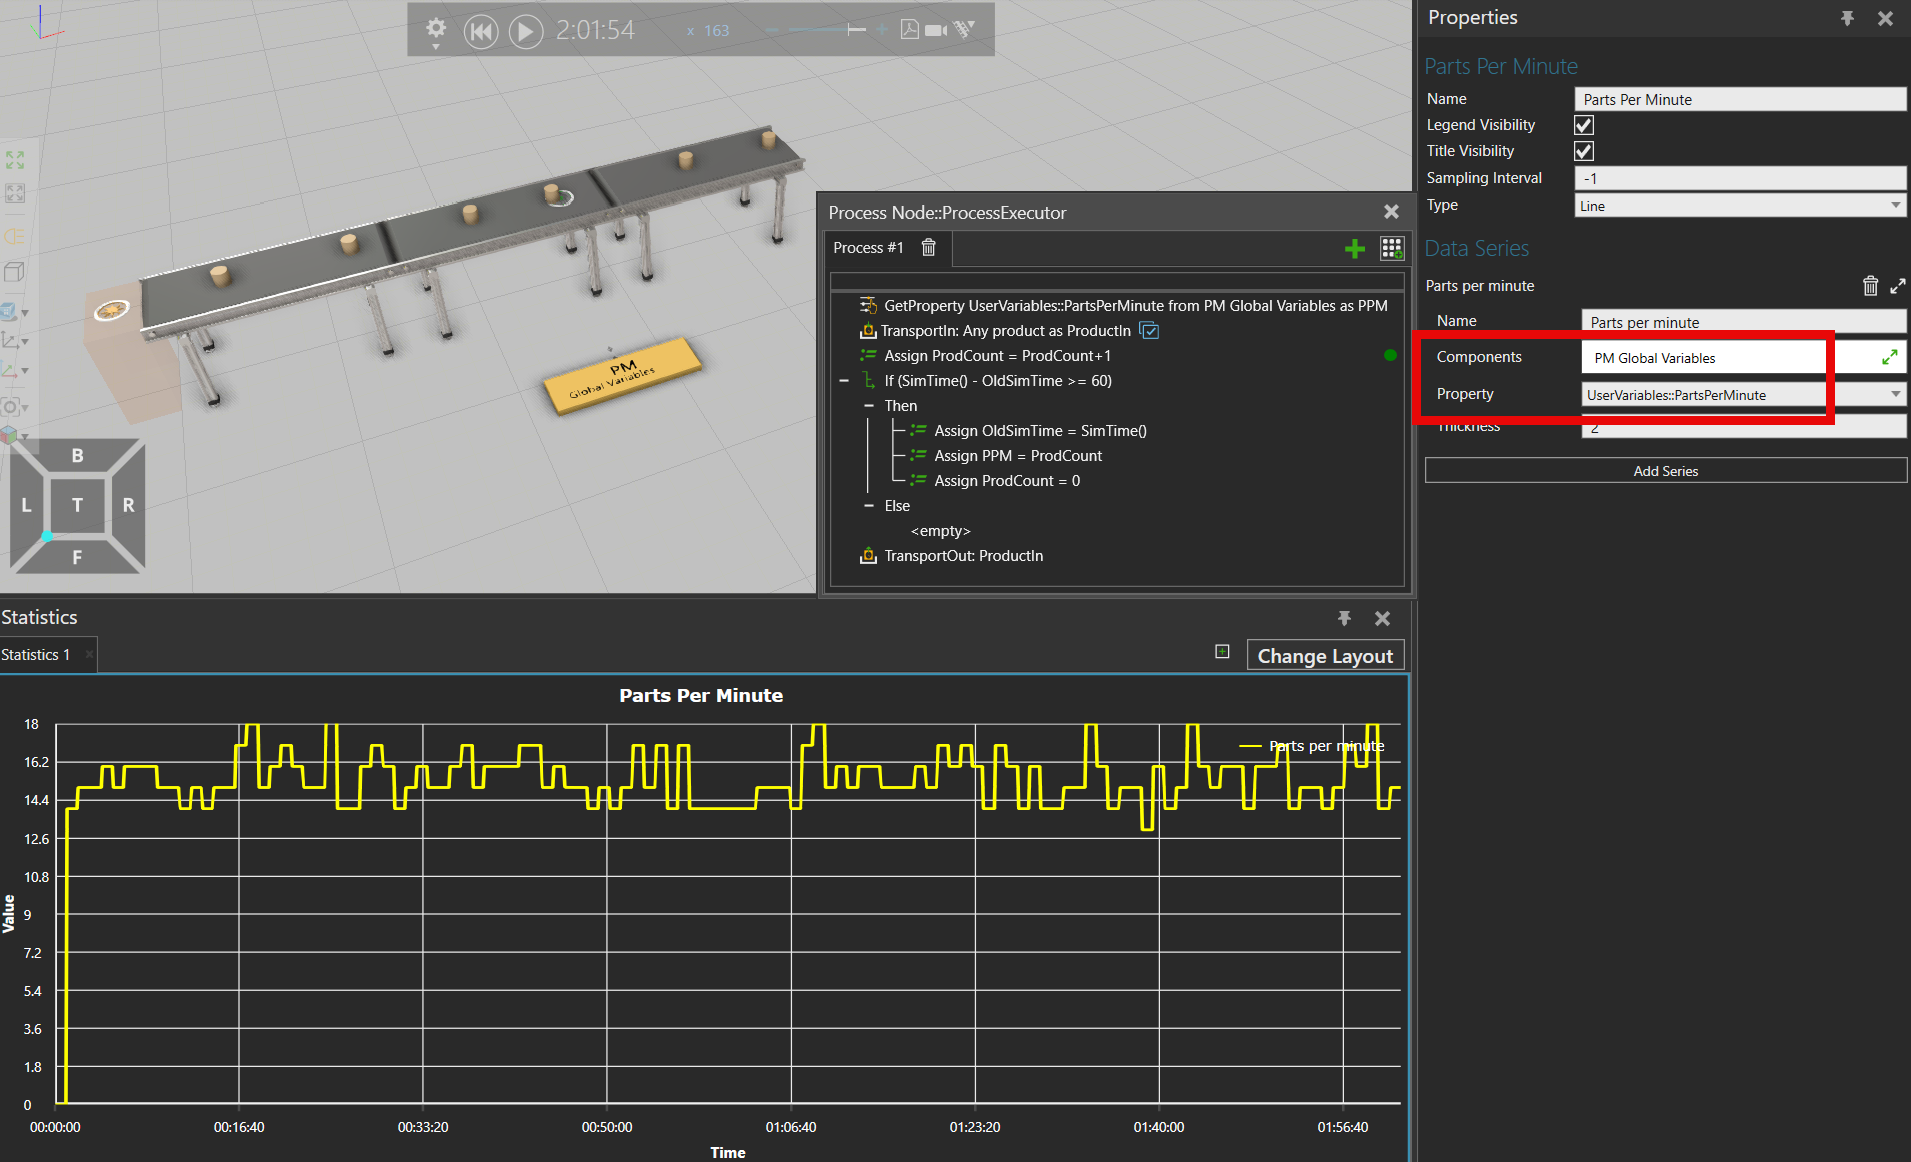
Otherwise, with the method shown above, you can also use a normal Line Chart in your statistics for example, then choose the component where the property is, and its property.
In this case, you could have a different statistic intervall, but keep in mind that the value are going to be reported according to it.