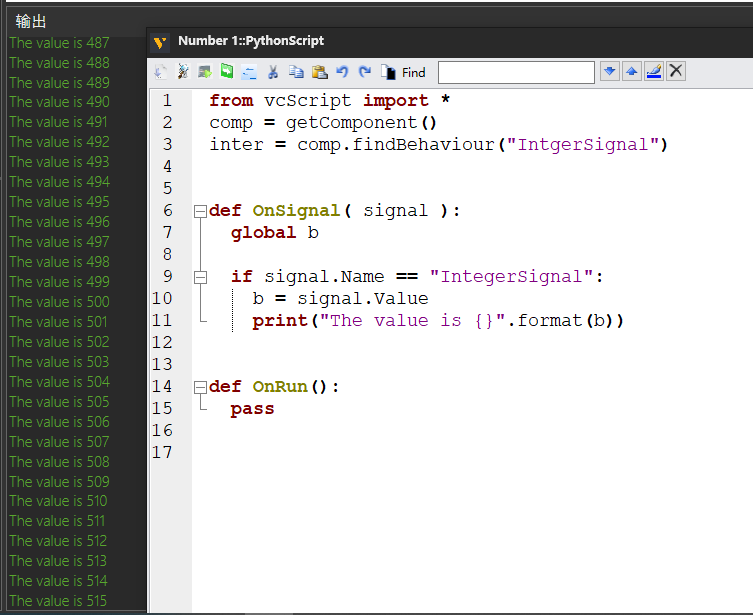
Hi everyone, How can I use python script to create a statistical table to display the values in the graph. thanks in advance.
Just like the picture show