Hi,
I would like to create a chart, which shows me all the statistics of all my processes (busy, idle, failed, setup etc.) sorted by process. Something like a stacked barchart (100%).
I wasn’t able to find a way to create that in the statistics windwos. Is there a way to create something like this or do i have to export the data and visualize that in an other software?
Thank you.
Regards
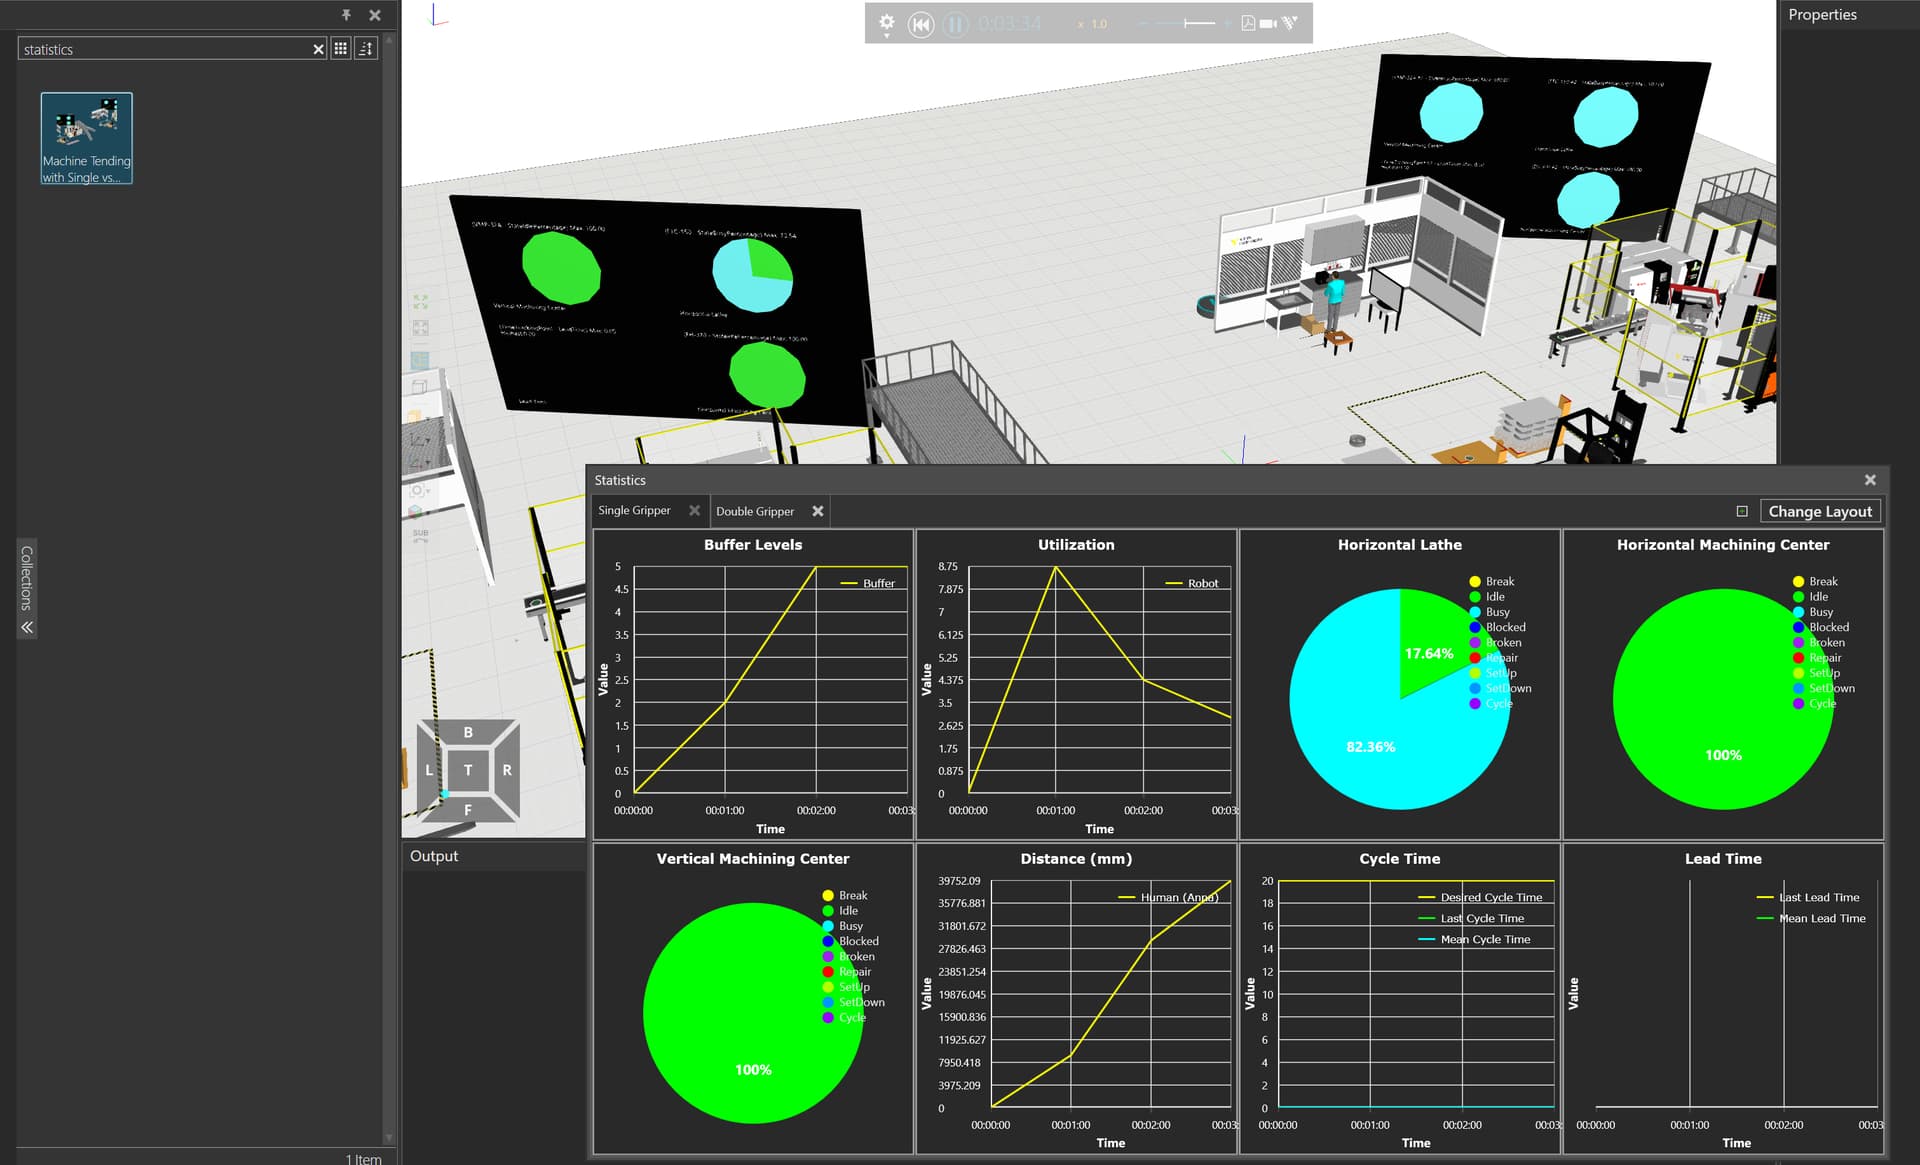
What kind of charts do you want? In the Layouts example, Machine Tending with Single vs Double Gripper has a lot of diagramming applications:
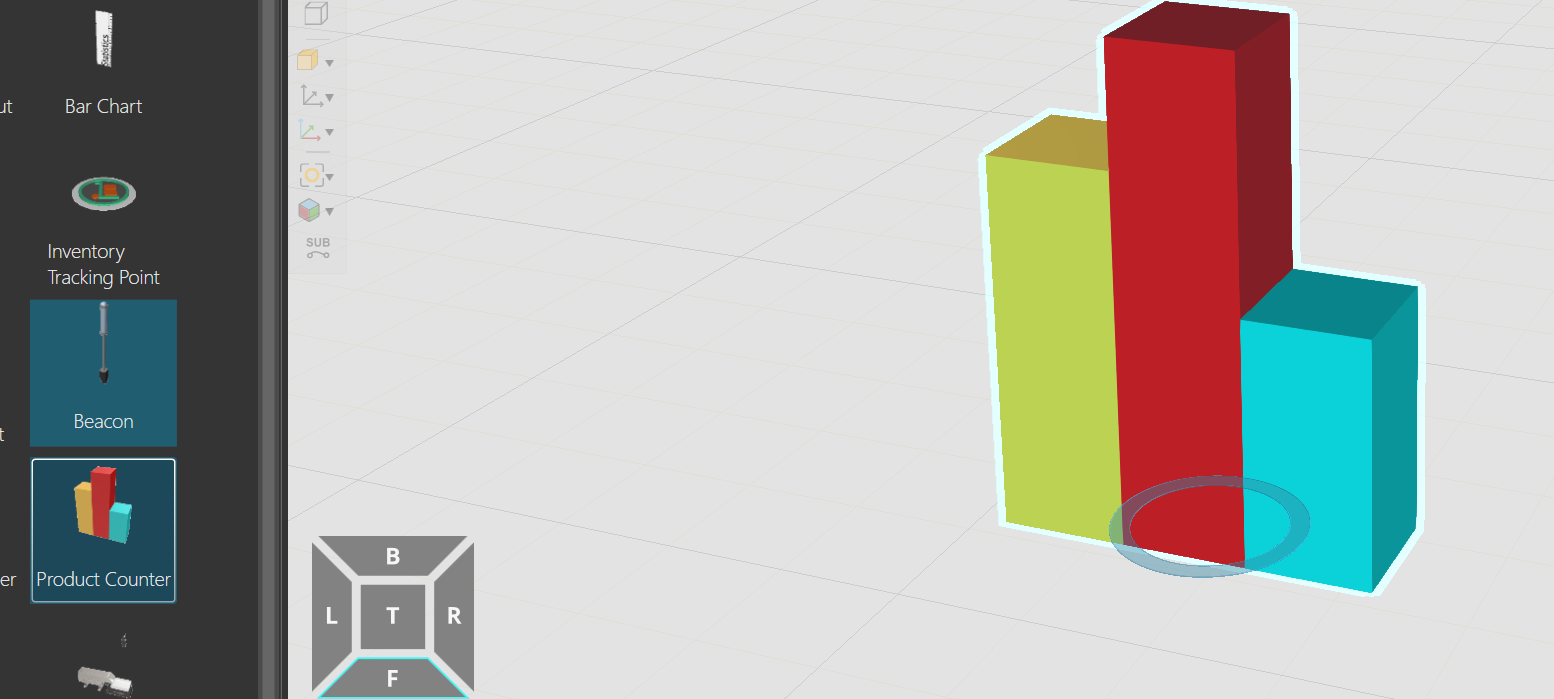
Or do you need this histogram model?
If you want to know how to link them, you should go to the academy to learn about them.
Hi,
Tank you for your answer. In my case i would like to create a stacked bar chart (100%) for each process node with the stats (busy,idle,failed,setup,blocked). I would like to have one chart for all nodes instead of multiple charts. I was able to do the pie chart like this, but only one chart for each process. i would like to compare the processes on the same scale.
I have also read the template tutorial and tried to implement something with this, but i could get it to work as described.
Is there something where templates of others can be shared?
Best Regards