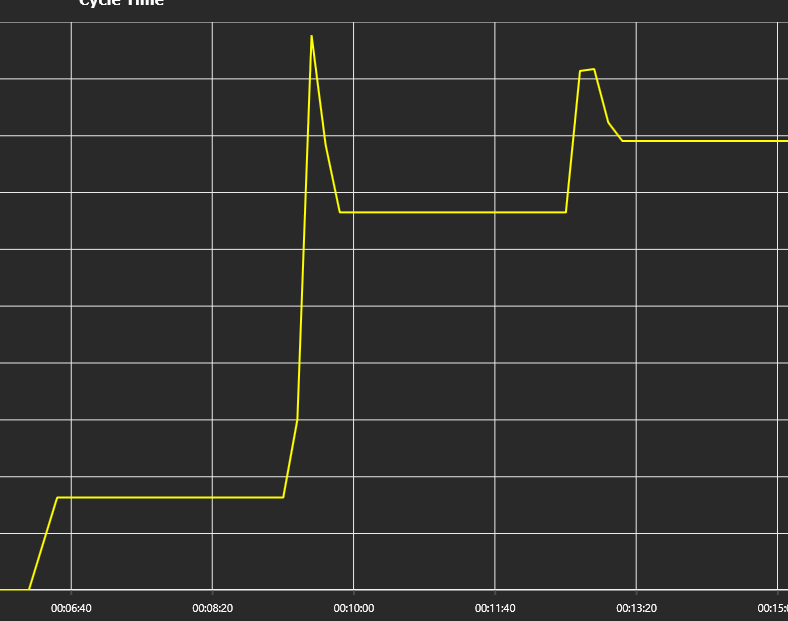
Hello, I have difficulty reading the yellow color when viewing my measurement results in the graph. Where can I change this color?
Thank you!
Hello, I have difficulty reading the yellow color when viewing my measurement results in the graph. Where can I change this color?
Thank you!
hi,
You can try with Python Scripts as example
from vcScript import *
import vcVector
app = getApplication()
dashboard = app.Dashboard
tab = dashboard.SelectedTab
chart = tab.Charts[0]
data_series = chart.Series[0]
black = vcVector.new(0,0,0)
white = vcVector.new(1,1,1)
red = vcVector.new(1,0,0)
green = vcVector.new(0,1,0)
blue = vcVector.new(0,0,1)
yellow = vcVector.new(1,1,0)
pink = vcVector.new(1,0,1)
light_cyan = vcVector.new(0,1,1)
grey = vcVector.new(0.5,0.5,0.5)
color = green
data_series.Colors = [color]